Note: this is my personal commentary and this post is not officially endorsed by Givewell in any way.
Givewell is one of the most admirable philanthropic organizations out there. They recognize and act upon a number of important truths:
- Money is a super powerful tool for reducing harm in the world
- Money can be used in more and less effective ways
- The effectiveness of money can be modeled with finite (possibly wide) uncertainty bounds at a non-trivial confidence level
- Encouraging those with the means to donate money to effective causes is important and worthwhile
- Moral judgement is an inseparable part of judging the effectiveness of an outcome
Not only does Givewell maintain an active blog, a Giving 101 section of its site, run free events in the Bay Area every few months and deliver well-curated email updates, but they keep updated copies of their Cost Effectiveness Models and Guide to Cost Effective Analysis available online for everyone to view. Transparency is explicitly a core value of the organization.
After digging through some of this available content in detail, I’d like to lay out a few key points and assumptions as clear a manner as possible.
First, they talk about the relationship between income ($$$) and consumption (value of used goods and services). It is difficult to infer one from the other - for example, a household’s crop production may contribute to consumption (if they consume the crops), income (if they sell the crops), or both.
Givewell states:
When modeling interventions that we expect will alter people’s productivity or work success, we prefer to think in terms of consumption rather than income…Consumption measurements are in some sense “the gold standard” for measures of material well-being in development economics research. (source)
Unfortunately, research often only measures income, as consumption is more difficult to reliably quantify. A reasonable approximation is to assume that consumption and income are equivalent:
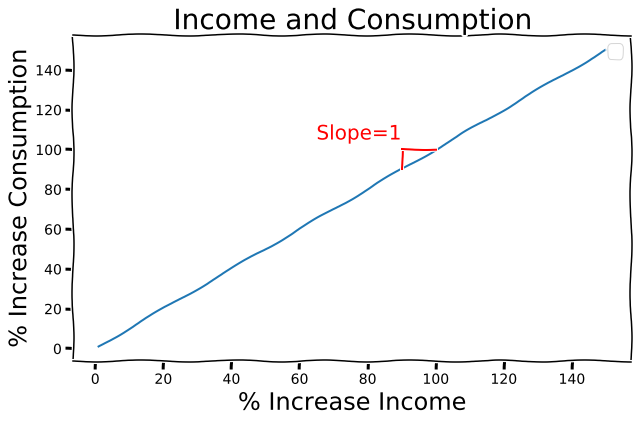
From this point forward in my discussion and in all Givewell documentation, it is reasonable to think of income and consumption as equivalent unless otherwise stated. I will arbitrarily choose to use the term consumption to represent both.
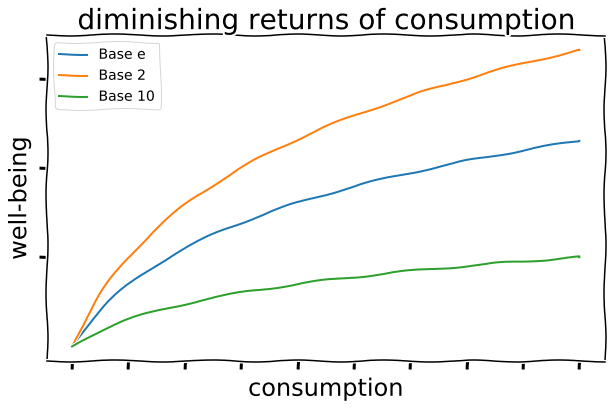
When examining consumption in relation to well-being (well-being representing self-reported happiness, decrease in suffering, hope for the future, etc.), it’s intuitively true that increasing consumption linearly would yield diminishing returns in well-being. At low levels of consumption, an extra \$10/day may result in a doubling or tripling of one’s well being! At high levels of consumption, an extra \$10/day may feel almost like an insult if its meant to measurably increase ones well-being - the economic equivalent of “you want a cookie or something?”.
For each base on the plot below, it can be said that “well-being increases an equivalent amount (one unit) each time consumption is multiplied by {the base}”.
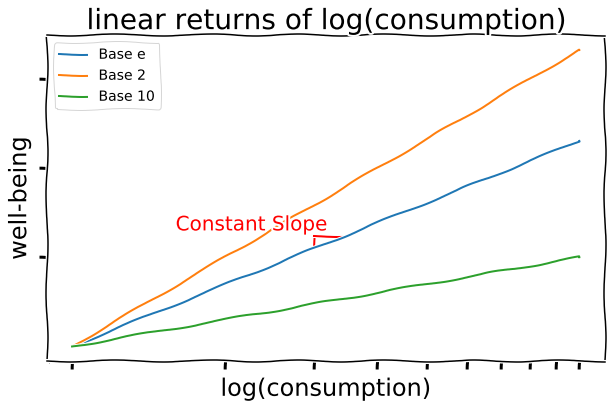
Another idea: rather than a linear increase in consumption increasing well-being a proportional amount, a doubling in consumption increases well-being a proportional amount. So \$10/day to \$20/day increases well-being an equivalent amount as \$5,000/day to \$10,000/day. This is a logarithmic relationship, in this case base 2 for a doubling. In practice, Givewell uses base $e \approx 2.72$, which isn’t much different.
This is assumption is supported in this paper which provides the plot shown below. Givewell recognizes the uncertainty here:
“The actual relationship between well-being and wealth is hotly debated.” (source)
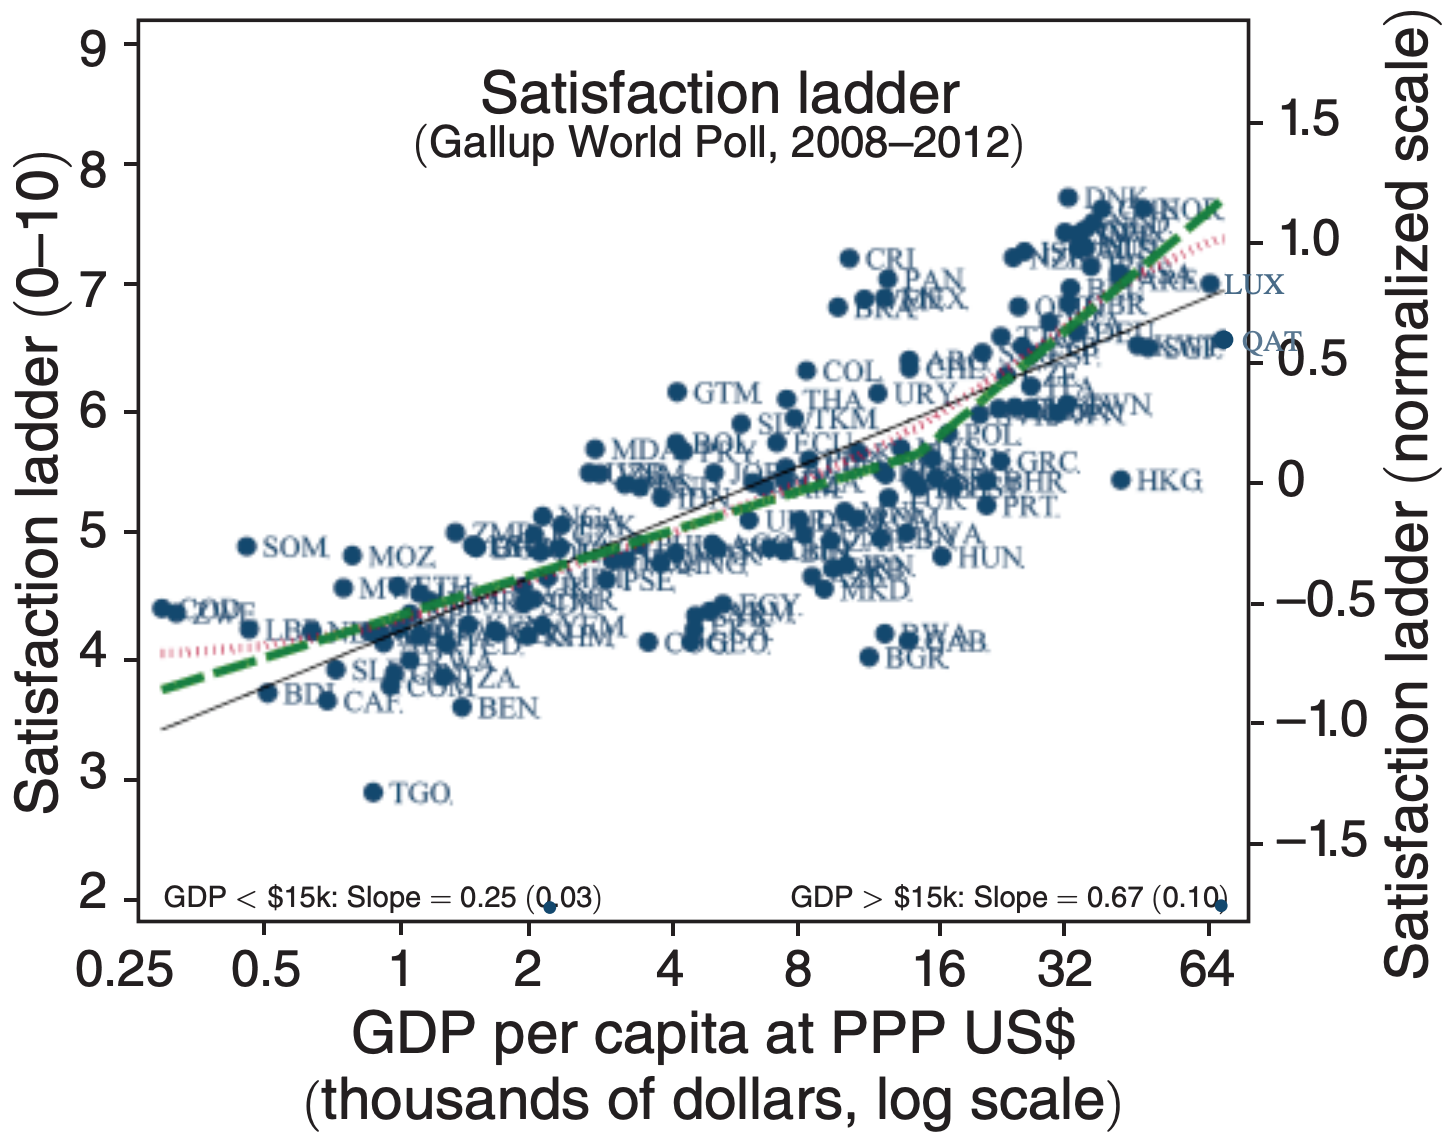
The above research shows one measure on the y-axis: the satisfaction ladder, a measure of self-reported happiness. Givewell extrapolates this research such that the y-axis can just represent well-being of any metric. This is reasonable as long as the assumption that a linear-logarithmic relationship exists between consumption and the metric serving as a proxy for well-being.
The constant slope of the linear-logarithmic between well-being and consumption is something useful. It represents the increase in well-being per unit increase in $ln(consumption)$.
Givewell asks “what would be the increase in well-being per a doubling of consumption from $c_1$ to $2c_1$?”. This doubling of consumption is chosen arbitrarily and doesn’t have anything to do with the base of the model - logarithmic base remains $e$.
$$ Slope = \frac{x}{\ln{2c_1} - \ln{c_1}} $$ $$ = \frac{x}{\ln{\frac{2c_1}{c_1}}} $$ $$ = \frac{x}{\ln{2}} $$ $$ \approx 1.443x $$
What is $x$? Well, $x$ is the amount well-being increased when consumption doubled. This could be read off the satisfaction ladder plot above, but then the slope would be valid only for that particular well-being metric. Instead, Givewell defines $x$ as the general value assigned to doubling consumption for one person for one year.
With this definition, say self-reported happiness increases by 3 units every time consumption doubles. The value of increasing happiness by 6 units caused by a quadrupling of consumption would then be $2x$. Consumption doubled twice, leading to twice the general value of doubling it once.
Slope, a function of $x$, can now be used to calculate the increase in well-being $\Delta WB$. Say an intervention causes a consumption increase of 4 times for one person in one year:
$$ \Delta WB = slope*(\ln(4c_1) - \ln(c_1)) $$ $$ \Delta WB = \frac{1}{\ln{2}}x*(\ln\frac{4c_1}{c_1}) $$ $$ \Delta WB = \frac{\ln4}{\ln{2}}x $$ $$ \Delta WB = 2x $$
Recall that x is the general value assigned to doubling consumption for one year. Increasing consumption by 4 times for one person for one year results in a well-being increase of twice the value of only doubling consumption.
Keeping things general like this may seem arbitrary and overly confusing now, but the real value of this method comes in when moral judgement is brought in to play. Say one would like to compare the value of doubling consumption for an individual in one year to the value of saving a young childs life. If one judges that saving the child’s life is 50 times as good as doubling consumption, then set the value of that outcome to 50$x$! After some math, outcomes can be compared to one another.
I’d like to continue digging through Givewell’s open sourced materials. Likely future additional writing/projects to come.