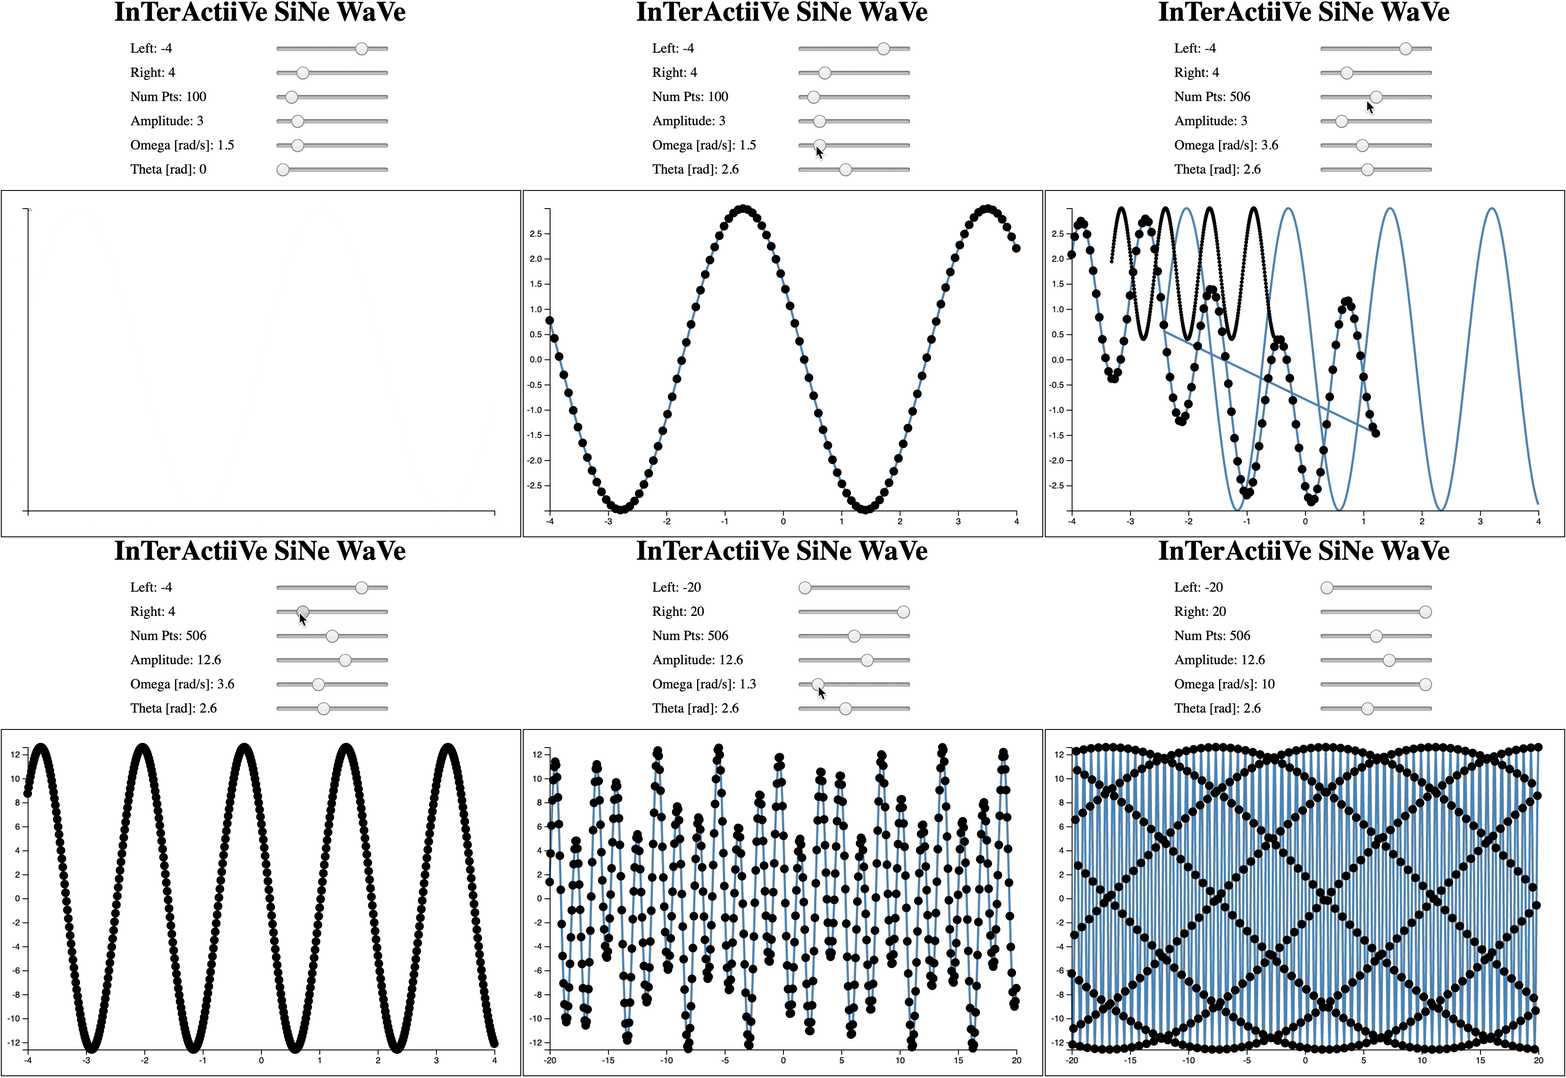
This week, I completed project 3 of Nand2Tetris, learned some deeper fundamentals of statistical learning in R, and wrote my first interactive thing in D3.
D3.js is a widely used javascript library for creating beautiful, interactive visualizations on the web. I made quite a simple interactive sine wave plotter, but the exercise took hours and really helped me gain insight in to D3’s declarative approach to data-centric object manipulation. Code for the thing here. Play with it here.

R is a tool for statistical computing and visualization. It is often used in research and many awesome data scientists work in both python or R depending on the application. Much like python, there have been a huge number of tools and packages built for and on top of R (matplotlib = ggplot2, Plotly’s Dash = Rstudio’s Shiny, Jupyter Notebooks = R Markdown, etc.)
I was hesitant on learning R because so much of the language has a python analog and I’m already proficient in python. After some conversation and reflection though, it does seem like a good thing to learn. The language of R is geared explicitly towards statistics. As a basic example, here is how to get 100 samples from a normal distribution with zero mean and unity variance in each language:
# python
import numpy as np # could also use a scipy function
np.random.normal(loc=0, scale=1, size=100)
# R
rnorm(n=100, mean=0, sd=1)
It’s not just that it’s 2 lines of code versus 1. It’s that rnorm is built in to the standard library in R whereas in python you have to import a package like numpy or scipy. I use these packages so much in python that I sometimes forget they’re not in the standard library! This reinforces the premise that python is the second best language for everything. R should help me think statistically as it is a language primarily written for statistical thinking.

I was alternatingly enthralled by and so frustrated with the textbook An Introduction to Statistical Learning this week. The second chapter is so methodical in describing intuition for general model fitting, the bias-variance tradeoff, what model flexibility implies - all these great fundamental concepts! Then the third chapter seems to try to summarize all of mankind’s theory on linear regression in 60 quite dense, sometimes incomprehensible pages…enter the frustration.
In our Machine Learning meetup group, the group was split on the textbook. I’ve come to the conclusion that I’ll just have to take it slower and reference outside resources when required. Two chapters/week is way too ambitious. I’ll take the R exercises seriously and try to do derivations and note taking myself as required.
The way I’m seeing things is the interactive data viz/web dev stuff is fun and lighter, the stats fundamentals is hard and necessary, and Nand2Tetris is perfectly balanced between the two. There’s definitely the ongoing struggle with wanting to learn more, faster, but someone referenced this quote in their technical presentation this week and it was quite helpful:
Never discourage anyone who continually makes progress, no matter how slow…even if that someone is yourself.
Onward!